Looking Ahead to The 2019 Boston Marathon
The below data is based on the preliminary results of The 2018 Boston Marathon. The conditions were miserable. The wind was strong and the rain/sleet was challenging. Last year was a scorcher. The results were surprisingly similar for those that finished.
Average Finish Time for Those With a Qualifying Time (Elites Excluded)
3:42:14(3:45:13 Last Year)
Average Boston Qualifying Time (Elites Excluded) – Estimated
3:21:48 (3:22:27 Last Year)
(A 10.1% Differential. I calculated the 2017 variance as 11.26%)
Average Finish Time for Those With a Qualifying Time – MALE (Elites Excluded)
3:33:37 (3:35:54 Last Year)
Average Boston Qualifying Time – MALE (Elites Excluded)
3:11:43 (3:11:57 Last Year)
An 11.4% Differential (12.41% Differential Last Year)
Average Finish Time for Those With a Qualifying Time – FEMALE (Elites Excluded)
3:53:14 (3:56:15 Last Year)
Average Boston Qualifying Time – FEMALE (Elites Excluded)
3:34:35 (3:34:54 Last Year) An 8.7% Differential (9.91% Differential Last Year)
Relative to their qualifying times, Women performed better in Boston in 2018 as well as in 2017.
29978 Runners were registered, 3030 of those did not start the race. Last year 2783 runners didn’t make it to the start.
25746 Runners Finished (Before any disqualifications) 95.6%. Last Year 97% of Runners Finished.
As the data shows, the runners that finished the 2018 Boston Marathon performed better than their 2017 counterparts. However, there were a higher percentage of runners that DNF’d, and a higher percentage that did not make it to the starting line.
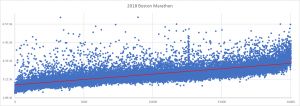
The above chart represents the basis for my investigation of qualifying times. The chart plots bib numbers against Boston finishing times. The runners I am most interested in are the stragglers well above the trendline. They ran Boston in a significantly slower time relative to others with similar qualifying times. In the upcoming days, for the purpose of review, I will create a modified version of this data with ‘predicted Boston times’ This prediction will be a function of qualifying time, adjusted for the average Boston finish time variance, and in many cases, adjusted for the ease of the qualifying marathon.
Please consider making a small contribution to help support MarathonInvestigation.com. Reader contributions are the main source of the funds that are needed to pay for servers, photos, data, etc.


I am really curious about those data points that are straight up in a line around bib number 12500.
non qualifying bibs. Police, Fire, sponsors, etc.
WHAT?!!! Non qualifiers got qualifying bib numbers? 12000-12999 are bib for qualifiers only, 2nd wave, corral 5. That does not seem right since seeding (corral placement) is based on the paces expected to run in order to not create bottlenecks (and as experienced year after year, always running around competitors that seem to be way too slow for the seeding they were placed in.
PS – which was my wave/corral. I ran a 3:21 for that seeding.
With all of the hoops associated with running Boston, I am shocked that 10% (roughly) of the people entered each year don’t even show up. That has to be a slap in the face to anyone who gets bumped.
Is there any way to tell if the DNS crew is mainly charity runner? I understand injuries happen, but not showing up when you have one of the toughest tickets in non-elite running is a shame.
One of my friends had the flu. I suspect this was many. Also, if you are injured, which is common among endurance athletes. Boston does NOT defer race registration to the next year, injured or sick. And sometimes people cannot afford it at the end. This is life. Things happen. I barely made it to Boston for my 6th consecutive because my mom was hospitalized for 5 weeks and my training suffered. My friends and family rallied around me and encouraged me to go and just have fun instead of run a fast A-race. Again, there are so many variables when it comes to being human and life (work, life, health, finance).
Maybe the BAA could take a tip from the airlines practice of over-booking, if they don’t already. They know the numbers so they can easily estimate to get closer to the actual runner limit on race day. If historically it runs at 10%, there’s little risk to just expand acceptance by say 5% at least. I’d be surprised if that’s not a practice already as it is extra entry fees.
I heard that a lot of flights from the midwest were canceled due to the bad weather, so well-intentioned runners weren’t even able to get to Boston on time. How disappointing that would be!
In 2017, I tore my plantar fascia a month before the race. According to you, I should still spend a thousand dollars for the weekend trip to go watch a race I should be running because someone slower than me got bumped? Maybe they should just run a faster time. It’s running, people get hurt, people have jobs, people have children. It’s not the Olympics.
Average Boston Qualifying Time (Elites Excluded) – Estimated
3:21:48 (3:22:27 Last Year)
(A 10.1% Differential. I calculated the 2017 variance as 11.26%)
That is a 39 second difference in average qualifying times, which is a difference of about 0.3% not 10.1%.
That is the variance between qualifying time and the time run in Boston. Not the difference between the 2 years. I probably didn’t explain that clearly.
I am guessing that for non-elites, lower temperatures (even with rain) are preferable for fast performance, even if the run itself is a more miserable experience.
On “scorcher” days, overheating is a huge issue. It may be more “fun”, but heat can cause slowness.
100%!! I ran easy this year for a 3:31 (my easy pace) and it was thoroughly enjoyable and easy, even w/ the 40mph wind. W/ cold weather, you don’t experience the thirstiness like heat; that means only stopping at aid stations to take water for gels and salt.
Last year and 2016 was hot AF and i suffered miserably. 2016 was a 3:45 (this is my recovery pace!!) and 2017 was a 3:59 (LOL pathetic). These times are reflective of me stopping EVERY mile for every aid station (for two cups of water) and for 2017 since it was in the 80s w/ a tailwind (which makes it feel like 90F instead); I even stopped at 2 aid stations each mile (they are staggered on the left and right).
I am also a northern European descent, so I do really really really well in the cold. My paces in the 7:30s come natural. Me pushing that pace after it gets to 55F and sunny, won’t happen.
Those that suffered the most in the Nor’easter were from the south; most of the african elites DNF’d.
I look forward to your explanation of that obvious vertical spike of abnormal results at about Bib# 12500. I assume it coincides with a significant qualification threshold.
I should have addressed that. The same spike was there last year. Those are non qualifying entries. Usually Police/Fire etc..possibly international travel bibs.
Ok, thanks! That makes perfect sense.
they shouldn’t have qualifier bibs though. 12000-12999 are in wave 2, corral 5. These are people who are finishing a marathon between 3:20-3:21.
The non charity exempt entries are given bibs in that range. The chart shows the same thing last year. Not saying I like the policy..but for my analysis, I am glad these runners are lumped together to make it easy to exclude.
Looking forward to seeing if I make your list! (Seriously) The data should play out that way, at least before you get into a deeper look.
Just for grins, let me know where in the process you filter me out of the bad boy/girl list (if you do ;-).
-Ray #7676
I’ll let you know.
Are you getting this data direct from the BAA?
The data is scraped from the live results.
Hey Derek,
I am wondering when you compare the average finishing time of qualified athletes with the average qualifying time, are you averaging the qualifying times of only those that finished? I think you are not, and since looking at the stats the DNF rate was skewed heavily toward the older age groups (it is always skewed some that way, but it was much moreso this year than 2017) that would mean you are effectively throwing out finishing times from slower people but not throwing them out from the qualifying average. I’m not sure I explained that well, but my conclusion is that your finishing time vs qualifying time variance was wider last year than this year, but maybe that is because of how the data is calculated. It doesn’t change anything in the analysis, except the perception might be that this year’s race was easier, which I would dispute.
I get your point. The only conclusion to make is that the conditions resulted in more DNFs, but the times among those that finished were faster on average.
I would agree that it was more difficult.
I ran 2017 and 2018 and ran 11 minutes faster this year. My qualifying time went up by 20 minutes, but after training in two brutal winters, I much preferred the cold rain to the heat in 2017.
Same! 2017 i did an embarrassing 3:59 (super freaking slow for me) because I suffer horribly in the heat and have to stop at every aid station along the way (about 44 total if you go to each staggered table).
This year, I ran easy for a 3:31. I ran the same average paces for both years (if you count the pace I was actually running in 2017, minus the time I spent at each mile’s aid station); but in the cold, I only stop at 8 aid stations for gel and salt, and one cup of water. And an 7:50-8 minute mile is easy for me in cold. I can push 7:20-30s easily for a marathon in that temperature.
Larissa, congrats on finishing all the marathons, I truly mean that. But IMO making statements about an embarrassing time of under 4 hours is a slap in many average joe/janes that run…many who may be running for a reason, charity, loved one… rather than time.
Congrats to everyone that trained hard for this challenging day!!!
Well said, Michaela! Mentioning it that many times seems a bit odd.
Way to stay humble Larissa 🙄
I am seeing elsewhere a report that 2018 Boston had 35.7% BQs, which would be significantly higher than the asserted 30.3% in 2017 and 33.6% in 2016. If those numbers are accurate, then there would be 9191 BQs this year, up from 8002 last year, despite the horrific conditions.
If that’s the data, that’s the data, but I was there and ran 12 minutes slower than my qualifying BQ and missed a BQ at 2018 Boston by 3.5 minutes. Everyone I talked to ran slower. The pros ran slower. Yes, I understand this is anecdotal and is trumped by the actual data. Having spent 3.5 hours in the slop (but I finished!), I would be amazed if the number of BQs went UP.
I guess what I am asking is, is the % of BQs this year I cited above true? Are you sure of the quality of your data scrape?
Thanks.
Yes, I am sure of the quality of the scrape. Pulled and validated directly from BAA. I have not calculated the % of BQs. I have not brought in the ages – only the age range is in the results scrape. Registration data had specific ages. So I would just need to cross reference. BAA posted some stats, not sure if that was one they posted offhand.
Thanks.
Will you be posting either the number of BQs or the % for 2018 Boston?
I have no idea of the origin and thus the veracity of the numbers I provided; it just something I saw on the net, so I would trust your data over it. I have not seen BAA provide that data; all I have seen BAA provide is what you already posted–number admitted, number started, and number finished.
Derek – would you guess that the additional 400 DNF runners (who know how many were qualifiers) account for the faster average finishing time among qualifiers? While I don’t know which year was tougher on runners I would assume a rainy cold day with light crowds encourages a struggling runner to step off more than a beautiful warm day.
That’s a good point. On a warm year, at least it’s still an enjoyable experience to blow up on the course and jog it in. Hell, you could even have a beer or two. This year, I’d bet most of those folks just tossed in the towel.
I am a qualifier and I am five months pregnant, so I opted not to run but had no option to withdraw or defer. A friend has a knee injury. We’d both have been there if we could.
I ran 7 seconds slower than my qualifying time (3:06:24 to 3:06:17). I finished 3880 spots ahead of my number (2774 to 6634). I’m wondering how many other runners were as close to their QT as I was.